Asset Allocation
SEG Investment Principles and Asset Allocation
While the use of asset allocation and diversification offer no guarantee against risk of loss, we believe there are four important principles that should guide our clients:
- Performance, per se, is not a goal. Creating a portfolio to meet your financial needs is our goal;
- A professional should manage your account. Just as you trust a pilot to fly the plane, or your dentist to care for your teeth, you should work with a competent financial advisor to manage your money;
- The dominant factor in long term, real-life return isn’t the market but the client’s behavior. Chasing performance is almost always a losing proposition. Statistics are clear that clients who stick to a long term plan do better than those chasing the latest “hot” idea. We call this "keeping your eye on the base rate, not the case rate", and,
- The key determinant of return within the portfolio is a proper risk-adjusted asset allocation.
WHAT IS ASSET ALLOCATION?
Asset allocation involves spreading your investments across different asset classes with the intention of maximizing returns, while at the same time, minimizing risks. This risk versus return equation needs to be balanced against your own personal investment situation. This is at the center of what is known as Modern Portfolio Theory (MPT), the creator of which is the winner of the Nobel Prize in Economics.
There are many assets classes one can choose from, ranging from the conservative (cash and bonds) to moderate (large cap, REITS, and medium cap stocks) to the more aggressive (small cap and international stocks). Each class will deliver a certain mix of risk versus reward. For example, cash offers very little Investment risk, but at the same time, little potential Investment upside or protection against inflation.
On the other hand, stocks have historically delivered much better returns over the long term. For example, from 1925 to 2005, large company stocks delivered a compound annual return of 10.4% whereas Long Term Govt bonds returned 5.5% for the same time period. Cash equivalents like T-Bills delivered a compounded annual return of only 3.7%, barely more than the rate of inflation.*
However, as was made painfully clear during the recent bear market, investing in the stock market DOES carry risk. This would have been particularly evident to people that had piled up on technology stocks hoping to participate in the 100+% gains sometimes experienced by investors at the peak of the technology stock buying frenzy. Many of these Investors eagerly chased individual stock selection tips from friends, newsletters and media programs like CNBC.
But as in all speculative bull market run ups, the good times ended quickly! The NASDAQ Index fell over 60% from March of 2000. Many tech laden Investors saw their investment portfolios decline by similar amounts.
This large market correction experienced in the technology sector has highlighted one of the fundamental reasons behind the need for Investors to apply asset allocation techniques - diversification. In layman's terms, diversification can be translated into 'Don't put all your eggs in one Basket'. By limiting their exposure to technology stocks through diversification, an Investor would have limited their loss of capital during the bear market.
Academic proof of the benefits of asset allocation can be found in a study of large pension funds over a 10-year period, which appeared in the Financial Analysts Journal, July-August 1986 edition.
This study showed that approximately 94 percent of variability of a fund's investment return is due to asset allocation
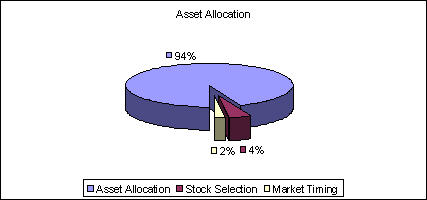
It also showed that stock selection and market timing accounted for only 4% and 2% of portfolio returns, respectively.
Lesson 2: Historical Asset Returns
To assist us in determining our asset allocation strategy, we need to first gain a better understanding of the returns (and risks) of asset classes historically.
To look at US asset returns, we refer to the comprehensive work of Professor Jeremy J. Siegel, of the Wharton School of the University of Pennsylvania. Professor Siegel has studied asset returns back over 200 years.
Siegel found that the return from an investment in equities far outperformed that of the other asset classes over time. An investment of one dollar in year 1802, assuming all dividends were re-invested, would have grown to $790,000 in 1999. This calculation allows for inflation, but does not take taxes into account.
Compare this to the $791 return of bonds and $292 return of T-bills over the same time period. Clearly, stocks have had a better return over the long term.
Lesson 3: Risk
Over the past century one sees steady returns in the markets over the long term, though some individual years see substantial declines. These declines are evident in the Depression, during the 1987 market declines, and the bear market of 2000 to 2002.
Most of us, even those new to investing, are familiar with the risk/return concept. It is further spelled out as ‘No Risk-No Return’. Leaving our money in a bank account is about as safe as it gets, in terms of protecting the capital amount. However, the spending power of the investment will erode with time, as the ever present effect of inflation bites. There is no such thing as a risk free investment!
A diversified portfolio based on the client’s personal risk profile is the method that the SEG chooses for our clients. Clients that try to chase performance and hot sectors have a very negative impact on portfolios over time.
According to Dalbar Inc.'s "Quantitative Analysis of Investor Behavior" study**, if you had bought and held the stocks in the S&P 500 stock index for the 20-year period between 1985 and 2005, you would have realized an annual average return of 11.9%. In contrast, the average equity investor actually earned only 3.9% annually. Inflation, meanwhile, averaged 3.4%.
As the saying goes, “it is not timing the market, but time in the market that counts.”
Past performance is no guarantee of future results.
Financial Planning | Asset Allocation | Portfolio Management
| Business | Non-profit
* Ibbotson Chart 1925-2005 Stocks, Bonds, Bills and Inflation.
** DALBAR Quantitative Analysis of Investor Behavior (2005) The DALBAR study examined real investor returns from equity, fixed-income, and money market mutual funds from January 1985 through December 2005. Inflation is measured by the consumer price index. The stock market is measured by the S&P 500 Index.
|